
Dear Analyst #63: Cleaning Bitcoin Tweet data with OpenRefine, a free and open source alternative to Power Query
Podcast: Play in new window | Download
Subscribe: Spotify | TuneIn | RSS
Numerous studies claim that data scientists spend too much time cleaning and preparing data (although this article claims it is a bullshit measure). I agree with some points in that article in that you should get your hands dirty with cleaning data to understand what eventually goes into the analysis. You may already be cleaning up messy data today with Power Query, an add-in for Excel ten years ago which now is its own standalone application. For those who don’t have Office 365, a recent version of Excel, or a Mac, what tool can you use for cleaning up data? The main tool I’ve been using is OpenRefine. The main reason I reach for this tool: it’s free. It’s like Power Query for the masses. I’ve been wanting to do this episode for a while, so get your messy dataset ready. The Google Sheet for the examples in this episode is here.
If you want to watch just the tutorial portion of this episode, see the video below:
OpenRefine history
You can read more about OpenRefine’s history on this blog post. The tool started as an open source project in 2010 before Google bought the company that created the tool (Metaweb). The tool was renamed to Google Refine for two years, but Google eventually stopped supporting it in 2012. The blog post cites a few reasons why Google stopped supporting the tool. I think one of the main reasons is that it’s a desktop application and not run in the cloud. This probably conflicted with Google’s own cloud ambitions for what is now Google Cloud Platform where they have data cleaning tools all in the cloud.

Since Google dropped support in 2012, it’s exciting to see a good number of contributors to the project and an active mailing list. One feature I think that will keep OpenRefine relevant among analysts and data scientists who need to clean their data is the reconciliation service (similar to Excel’s rich data types). More on this later.
Clean messy data, not organize clean data
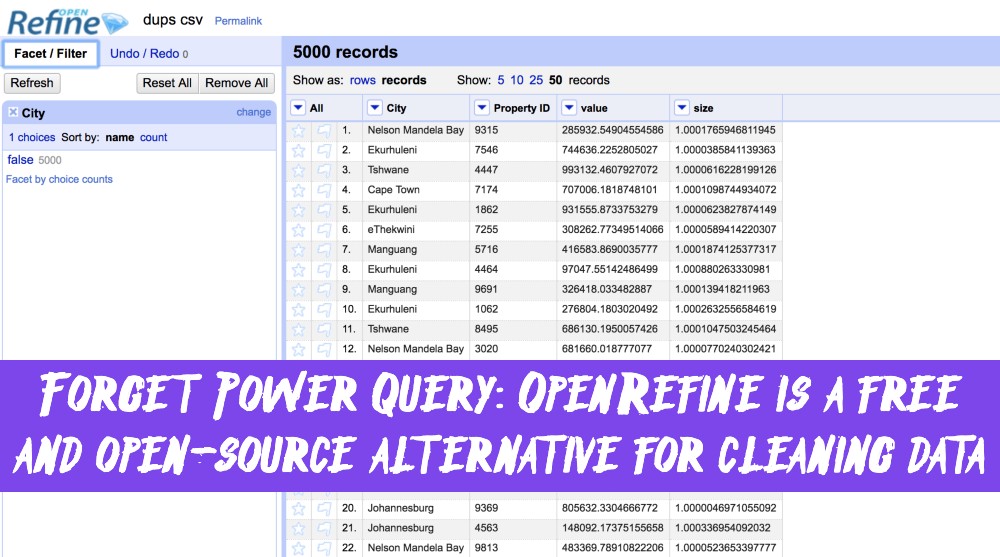
As I’ve been using OpenRefine over the years, I’ve found that I reach for OpenRefine for specific use cases. It doesn’t aim to be an all-in-one tool. When you first launch OpenRefine, you’ll see the main tagline for the tool in the top left:
A power tool for working with messy data.
It just says it like it is. It doesn’t do PivotTables, charts, or other things you might find in a spreadsheet tool. It does one thing and one thing well: clean messy data. I also think it does a good job of exploring outliers of your data, but it’s all in service of ridding your dataset of inconsistencies.
This post from Alex Petralia is a good read with regards to how you should think about OpenRefine:
In fact, what differentiates clean data from messy data is not organizational structure but data consistency. While clean datasets may not be organized as you’d like (eg. datetimes are stored as strings), they are at least consistent. Messy datasets, on the other hand, are defined by inconsistency: typos abound and there is no standardization on how the data should be input. You will only ever find messy datasets, practically by definition, when humans input the data themselves.
If you are working with data that is being produced by a computer, chances are OpenRefine will not be that helpful in terms of transforming your data into something you need to use for a downstream analysis. On the other hand, if you are working with a lot of user-generated data (as is the case with our Bitcoin Tweets data), OpenRefine is a perfect tool for the job and on par with Power Query.
Bitcoin Tweets
This is another dataset I pulled from Kaggle which shows recent Bitcoin Tweets in February and March 2021. There are a little under 50K rows in the dataset which represents a little over 30 days of Tweets. The main qualifier for these Tweets is that the Twitter user had to include the hashtags #Bitcoin or #BTC in the Tweet.
We’ve seen Bitcoin rise above $60K this past week and some of the rise might be due to all the chatter on social media. This dataset is a great example of messy data since you have the user_location column which isn’t standardized (you can put whatever value you want in the location field in Twitter). There’s also a hashtags column which of course can contain a variety of spelling of Bitcoin like “btc,” “BTC,” etc. So a lot of messy data to try to clean up and standardize using OpenRefine. More importantly for the Bitcoin speculators, you can try to spot some trends or patterns in the content people on the Internet are saying about Bitcoin and see if it correlates with Bitcoin’s price.

Cleaning up date formats
After loading the data, the first thing you can do to allow you to better sort, filter, and facet the dataset is setting the date format for certain column. In this case, I’m just transforming the date column to be a “date” format. Pretty simply stuff you can do in Excel or Google Sheets:
Here’s where things can get a little interesting. You’ll notice that for the user_created column contains dates with inconsistent formats. Sometimes the date will be in the U.S. date format with a timestamp (e.g. “3/19/19 21:33:01”) but other times it will be in the European format with the day followed by the month (e.g. “19/03/19”). I changed the dataset a little bit so that only the rows that have a date of February 10th have the European date format in the user_created column. So our goal is to convert those dates in the European format to the U.S. format.
First thing we do is isolate the rows that have February 10th in the date column. This can be done by filtering and faceting, two of the most common operations in OpenRefine. If you do the timeline facet, you’ll get this nice scatterplot in the left sidebar showing how your data is distributed based on the date column. Unfortunately, we can’t exactly pinpoint February 10th on this facet:

As you move the left and right handles in the timeline plot, you’ll start seeing the number of records getting smaller. It’s a nice way of filtering out the rows you don’t care about. I’m going to do a basic Text filter and just look out the dates that contain “2021-02-10.” I now have 3526 rows out of ~50K that match this criteria:

Now I can start transforming the user_created column so that the date is in the format I want. After you click on “Transform” in the column settings, you’ll see a field to utilize OpenRefine’s on coding language called GREL (General Refine Expression Language). It feels very similar to Javascript. We can start transforming the column of data by using the value variable to get the date format we want. As you type the expression in the box, you see what the output looks like in the preview pane below:

After you apply the transformation, OpenRefine changes the date for you in that column to the format that we want. You can remove the filter or facet and then apply the “To date” transformation to this column so we have a clean date column to work with.
Adding column from examples in Power Query
By filtering and faceting your data and then applying transformations with GREL, you’ll be able to do a majority of data cleaning tasks that you might do in Excel or Power Query. This totally could’ve been done in Excel, but you’d be creating a couple columns to store the correctly formatted data and doing MID() formulas left and right.
In Power Query, the Add Column from examples feature basically does the date cleaning task I just showed above in a more user-friendly way. Instead of writing out your own expression, you start typing in the date you actually want next to the “dirty” date, and then Power Query infers what the date format should be and fills that transformation down for you to all your “dirty” dates. Behind the scenes, Power Query writes the expression for you in its own M formula language. This prevents you from having to write it all out yourself. A little more magic and a little less control.
Clustering and editing groups of values
This is the main feature I use in OpenRefine when dealing with messy data. Nothing is worse than having the city “London” spelled in 10 different ways when you’re trying to build a report based on, well, London. What if the “L” isn’t capitalized, or the person shortened the spelling to “Lon?” This is exactly what the Cluster and Edit feature aims to solve.
The user_location column in our dataset is filled with inconsistent city and country spellings, so this is a great use case for Cluster and Edit. Once you apply this feature, you can filter on the number of rows in the cluster (among other filters) to quickly fix the major data inconsistencies in the dataset. Surprisingly a large number of Twitter users cite “Lagos, Nigeria” as their location. Once you see that there is a consistent spelling of a city name, you can merge the inconsistent spellings to start cleaning up the data:

At the top of the menu, you’ll see the Method and Keying Function dropdowns. These are different algorithms you can utilize to group the data if the current algorithm doesn’t appear to capture all the inconsistencies. I really like this feature because I don’t aim to get a perfectly clean dataset if the number of clusters is very large (as is the case with this dataset). I just care about cleaning up the major problems, and dragging the handlebars on the right allow me to find those problem values.
The Cluster values feature in Power Query allows you to do something similar, but I think OpenRefine’s multiple algorithms and ability to filter down to the clusters you care about make OpenRefine more robust for handling misspellings.
Reconciliation and rich data types
A lot of people in the Excel community are cuckoo for Cocoa Puffs when the data types feature was released. Instead of copying and pasting additional data about stocks or geography into your Excel file, data types allow you to pull this information automatically from Wolfram.
OpenRefine’s analogous feature is called reconciliation. Not going to lie, I think the naming of this feature could be better. Feature name notwithstanding, you can “enrich” your existing data with numerous reconciliation services. From doing a quick scan of the different services, it does feel like there’s an academic bent on the types of libraries available. I’m going to use a basic Wikidata to see what additional data we can find based on the user_location column in our dataset. After you click on Reconcile and then Start Reconciling in the column settings, you can add services by adding the URL of the service. With the Wikidata service, I’m going to see if I can make the user_location column a rich “data type”:

The “use relevant details” settings gives the ability to include additional columns to put into the request from the service so that it can better find a match for you. I’m going to leave that alone for now and see what this does for our dataset:

For some locations, it found perfect matches like “Atlanta” and “London.” For values like “Europa,” we have the option to click on the box with the one or two checkmarks. This is applying data cleaning to the data enrichment process. Perhaps I only want row 5 to be the “Europa” rich value (in which case I would click the box with one checkmark). If I want all 50 instances of “Europa” to resolve to the rich value Wikidata suggests, I would click on the box with two checkmarks.
If you click on the new value in this location column, you’ll see the Wikidata page for that value. Let’s try to project out some values from this “enriched” data. After clicking on “Add columns from reconciled values,” you’ll see a lit of available properties you can add to the dataset. At this stage, you can click a property and preview what the values might look like before committing the operation. After adding the “head of government” column, we get another rich data type:

On the left sidebar, you can further filter the “best candidate’s score” so that the new head of government column includes only the best matches based on the location provided to the service. This is another great data cleaning feature to remove any false positives where the fuzzy match didn’t work out as well as we would’ve liked.
Other features for reaching parity with Power Query
Before you go off and start saying OpenRefine might look great for data cleaning, how does it compare to the other features available in Power Query?
Recording steps in data transformation process
One powerful feature in Power Query is the ability to see the different “steps” in the data transformation process. OpenRefine also has these steps that let you go forward and backward in the process. It’s kind of like going to a step in a macro:

If you’ll be applying the same “steps” to cleaning up your data in the future, you can export the steps and apply them to another instance of OpenRefine. This way you don’t have to do the manual process of doing each step all over again. You get this json-like code of transformations which you can save into a text file:

Export into multiple formats
Just like Power Query, you can export the final cleaned dataset into an Excel file, but there are many other formats OpenRefine allows. My guess is that others in the OpenRefine community have built other exporters to connect your output into other online tools that you might use in the workplace:

Merging tables not available
One feature that’s not available in OpenRefine is the ability to merge different datasets together with a point-and-click interface. Specifically, this is the ability to denormalize or “unpivot” your data so you can get one long stats table. This is possible if you use the cross function in the GREL language, but it requires coding the transformation you’re looking for versus clicking on a few dropdowns in Power Query. Again, the tension between the tool doing magic and the tool giving you control.
Other Podcasts & Blog Posts
In the 2nd half of the episode, I talk about some episodes and blogs from other people I found interesting:
- The Peter Attia Drive podcast # 142: Robert Abbott: The Bobby Knight story—a cautionary tale of unchecked anger, ego, and winning at all costs


Trackbacks/Pingbacks
[…] at Box, Box had Box Notes and Dropbox had Dropbox Paper. Both of these products were based on the open source tool Etherpad for real-time collaborative document editing. Matt thought, why not build something […]
[…] to export Jira issues into spreadsheets is reporting. We also talked about using other tools like Power BI for reporting purposes, but the intermediary step between Jira and Power BI is still a CSV […]