
Dear Analyst #66: How to update and add new data to a PivotTable with ramen ratings data
Podcast: Play in new window | Download
Subscribe: Spotify | TuneIn | RSS
PivotTables have been on my mind lately (you’ll see why in a couple weeks). An issue you may face with PivotTables is how to change the source data for a PivotTable you’ve meticulously set up. You have some new data being added to your source data, and you have to change the PivotTable source data to reference the additional rows that show up at the bottom of your source data. This may not be a big issue for you because maybe you’re not getting new data added often so manually going into the PivotTable settings and changing the reference to the source data doesn’t feel onerous. If you have new data coming in every day or every hour, you may want to automate this process.
Here are a few methods to accomplish this in both Excel and Google Sheet. My preferred method is to turn your source data into a table in Excel or reference the entire columns in Google Sheets. Download the Excel file or copy the Google Sheets with the dataset for this episode.

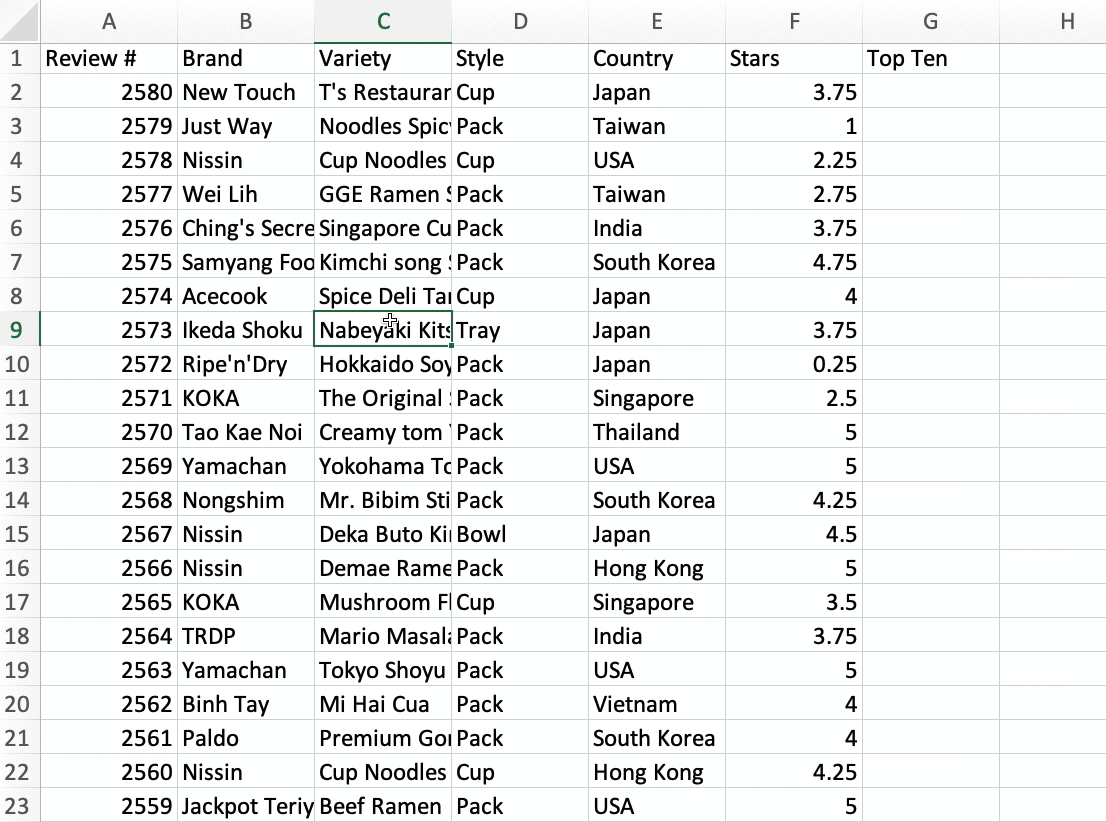
Ramen ratings from ramenphiles
I’m a big fan of these niche datasets like the one for this episode. It’s a list of ramen products and their ratings created by a website called The Ramen Rater. The list consists of 2,500 ramen products along with that product’s country of origin, the style (Pack or Bowl), and of course the rating. It appears the ratings are all done by one person. More importantly, the list contains the full name of the ramen product which means you can do some interesting text analysis to see what words are used most often in ramen products, how words might correlate with ratings, etc. For our purposes, this dataset is a great for creating a PivotTable with the rating being the main metric to analyze.

Method 1: Reference the entire column
Excel PivotTables
As shown in the first screenshot, the source data for the PivotTable in the Excel file comes from the “ramen-ratings” worksheet from cells $A$1:$G$2581. As you add more data to the source data, you’ll have to change the source reference to reference a higher row number. If you add 10 more ramen ratings, you’ll have to change the PivotTable reference to $A$1:$G$2591. We want to avoid having to change the reference every time we add new data, so we can just reference the entire columns in $A:$G:

The problem is the PivotTable we have in the “Ramen Pivot Table” worksheet now has this “(blank)” item in both the columns and rows fields of our PivotTable. Why? Because we’re referencing a bunch of empty rows of empty countries and ramen styles:
This isn’t a huge issue, because we can just remove the “(blank)” via the row and column filters:
Now when you add new rows of ramen ratings to the source data and then you refresh the PivotTable, the PivotTable will automatically pick up all the new rows of data since it’s referencing the entire columns from column A to column G.
Google Sheets PivotTables
The same solution applies to Google Sheets:

I find the user interface much easier to use in Google Sheets for a variety of reasons:
- Less clicks – Right when you click on the PivotTable (as shown in the above gif), you can see and edit the source data in the top right of the PivotTable field settings. In Excel, you have to click on the PivotTable Analyze tab in the ribbon and then “Change Data Source.”
- Can use left/arrow keys in cell reference – It’s a small annoyance in Excel, but notice how in the above gif you can just use the right arrow key to move the cursor to the right in the cell reference? This makes it easy to delete the row numbers. In Excel, using the left/right arrow keys changes the cell reference based on where your active cursor is in the spreadsheet. 9 times out of 10, you end up creating an incorrect formula and have to exit out of the menu, undo, or a combination of those two.
- PivotTable automatically refreshes – Less UI and more of a core feature in PivotTables in Google Sheets, but PivotTables automatically refresh when you add or edit data in your source. In Excel, you have to right-click and click “Refresh” or refresh via the ribbon every time you want to refresh the PivotTable. I’m sure there’s some pivot cache or performance reason why Excel doesn’t refresh automatically, but Google Sheets just gets it right on this one. I know there’s some settings in Excel like refreshing the PivotTable every time the file opens or refreshing the PivotTable at some interval you define (e.g. every 10 minutes), but it just adds additional overhead for the user who wants to just see their PivotTable updated in real time. This is 2021.
Overview of this method
For most use cases of PivotTables, I’d argue this solution is fine. This Excel file is pretty basic with one data source and one PivotTable. The dataset is also not super huge so you don’t have to worry about performance issues with referencing the entire columns of data with all those empty rows.
If you work in a corporate environment and you’re tasked with analyzing multiple datasets and have multiple data sources and PivotTables in your file, you may need something more scalable. This is where method 2 comes into play.

Method 2: Turn source data into a table (recommended)
Excel PivotTables
If you turn the source data into an Excel table and give the table a name, new data that gets added to the source will automatically get included in the table “reference.” Once you’re in the data source, press CTRL+T and hit ENTER to turn the data into an Excel table:
While your cursor is still in the newly created table, rename the table name to “Ramen” in the top-left:

Then we go back to the main ramen PivotTable, and change the source to equal this new Ramen table by just typing =Ramen in the Location field:

Now when you add new ramen ratings to the source data, the table reference automatically “expands” to include these new rows of data. In the gif below, I’m just copying some additional rows of data from another sheet and pasting it at the bottom of the Ramen source data table:

Notice how when you paste in the new data, the Excel table automatically expands the alternating row colors to include this new data. This shows that Excel was able to add this additional data to the table reference. If you refresh the PivotTable, it will automatically include the rows that got added since the source is still =Ramen.
Advantages of turning your PivotTable data source into an Excel table
Keep in mind: method 1 above is a totally acceptable solution for most simple PivotTable use cases. It’s really the edge cases where method 1 starts to break down. With method 2, not only do you eliminate some of these edge cases, but you get some additional benefits as well:
- (From method 1) Always need to deselect (blank) – If you’re doing any sort of bigger analysis, you’re going to be building multiple PivotTables. As you copy and paste the first able you created into new worksheets, that “(blank)” will always need to be deselected in the columns and rows. That shouldn’t be a problem in most use cases, but as you hit “select all” in the PivotTable filters as you’re doing your analysis, you’ll need to remember to scroll down to always keep that (blank) value deselected. It’s just some additional overhead that you don’t want to worry about.
- Easy to read table reference – Just as you may have multiple PivotTables in your file, you will probably have multiple data sources your PivotTables are built on. Instead of referring to the data source with the traditional A1:B2 cell references, it’s easier to just read a table reference as
Ramenand know that it’s referencing your ramen dataset. If you accidentally name the worksheet something generic likesource_data, you’ll have to double-check that your traditional cell reference is indeed referencing the ramen ratings data you’re interested in. - See all table references in one place – Building of of the previous benefit, you can quickly see all your table references driving your PivotTables in the “Define Name” button on the Formulas tab in the ribbon. If you need to see the exact cell reference for your tables, this is the main place to see those cell references:

Google Sheets PivotTables
Tables don’t exist in Google Sheets :(.

I’m baffled as to why this feature doesn’t exist in Google Sheets, but I’m sure the team will build this functionality at some point to get to feature parity with Excel. In my opinion, the fact that Google Sheets PivotTables auto-refresh as you edit or add data outweighs the benefits of turning your source data into PivotTables. Most Google Sheets PivotTables I’m creating these days are pretty simple in nature so I’m not working with many PivotTables or data sources in one Sheet.
Now there are some formula tricks you can do with the FILTER(), OFFSET(), and COUNTA() functions to replicate the features of Excel tables, but it’s not as simple as the Excel tables feature. It probably also isn’t very performant on larger datasets when you’re using these functions to reference the source data correctly. But it’s possible!
Other Podcasts & Blog Posts
In the 2nd half of the episode, I talk about some episodes and blogs from other people I found interesting:
- MS Excel Toronto Meetup: PivotTable Tips and Tricks with Bill Jelen (Jon Peltier comment at 1:51:15)
- Software Engineering Daily: Developer Community Management with Patrick Woods and Josh Dzielak


No comments yet.