
Dear Analyst #87: What we can learn about Enron’s downfall from their internal spreadsheet errors
Podcast: Play in new window | Download
Subscribe: Spotify | TuneIn | RSS
Everyone is probably familiar with the 600,000 emails released by Enron after their scandal right at the turn of the century. A lot of different analyses was done on those emails, but there’s one interesting analysis that I didn’t see until recently: the emails with spreadsheets as attachments. Felienne Hermans, a computer scientist at Delft University of Technology in the Netherlands, scoured all the emails that had Excel spreadsheets attached to them and analyzed 15,000 internal Enron spreadsheets to see what patterns existed in the models, formulas, and yes, the errors. After reading her paper, my opinion is that Enron’s spreadsheet errors were not unique to Enron, but could happen at any large company.

24% of Enron’s spreadsheets contain errors
One of the key takeaways from Hermans’ paper that has been cited elsewhere is that 24% of the spreadsheets she analyzed contains an error. These are spreadsheets where there was a “runtime” error, so the errors you typically see when you divide by 0 or make an error in your formula. Here’s a table from the report showing how many of these errors appears in these spreadsheets:
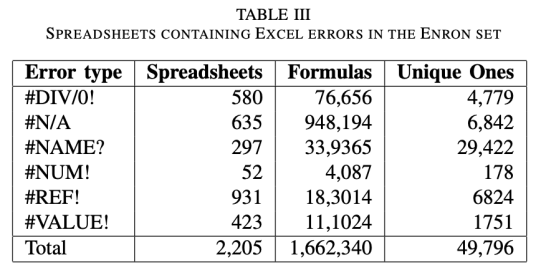
The sheer number of errors is startling:
In total, we have found 2,205 spreadsheets that contained at least one Excel error, which amounts to 24% of all spreadsheets with formulas (14% of all spreadsheets). They together contain 1,662,340 erroneous formulas (49,796 unique ones), which is 585.5 (17.5 unique ones) on average. There were 755 files with over a hundred errors, with the maximum number of errors in one file being 83,273.
755 files with over one hundred errors. It’s easy to say the people creating these spreadsheets weren’t skilled Excel users, or they were deliberately trying to make these errors. Putting the ethical argument aside, I’d say these Excel errors are only one side of the story.
A lot of times you might not have a finished model or haven’t collected all the data, so there may be formula errors until the final model or report is finished. I don’t believe Hermans scanned for the version of these files, so it’s likely that many of these files were simply incomplete. I’d argue that this is the predicament at many companies. You have files at various stages of completeness or readiness, so looking at the files with only these “runtime” errors can only tell you so much about the intention of the person who worked on the spreadsheet.
Auditing Enron’s files for accuracy beyond formulas with runtime errors
One type of formula error that wouldn’t show up in Hermans research is the formula that references incorrect cells. This can be due to human error or lack of understanding of how the model should reflect the business.
In a separate study by Thomas Schmitz and Dietmar Jannach done in 2016, Shmitz and Jannach looked closely at formulas that didn’t have normal runtime errors to see if they referenced incorrect cells. This is a much more difficult analysis because you have to know a bit about the business situation the model is based on, but most of the files in their analysis are quite straightforward.
Take, for instance, this Southpoint Gas Model which appears to show how much gas Transwestern (a pipeline subsidiary of Enron) is using on an hourly basis:

The Total Gas Usage column is a straightforward formula and one would think that the same formula is applied for all the rows in that screenshot. However, once you get to row 25 in the file, something not that uncommon happens with the formula:

The formula incorrectly multiplies the value from row 24 instead of row 25. In the grand scheme of things, this error probably didn’t cost Enron a lot of trouble (they had many other issues going on) and also wasn’t a costly mistake.
I think the bigger issue is how an analyst or someone who inherits this spreadsheet would have uncovered this formula error without doing some serious auditing of the spreadsheet.
How do these incorrect row reference errors happen?
It’s hard to say definitely, of course. One would think that when you first create the formula at the top of the list, you would just drag it all the way down to the bottom of the last row of data.
Perhaps the original creator added some new data starting in row 25, and just made a simple mistake of referencing the wrong cell. Then when they dragged the formula down, every subsequent cell has this formula reference error:

Another way this error might have happened (which I think is more likely) is the creator inserted a new value, but shifted the cells down instead of the entire row. For instance, let’s say I go into cell G15 and insert a new value, and say shift cells down:

You’ll notice that it affects all the formulas in the Total Gas Usage column by incorrectly referencing the wrong rows.
Why might someone insert a value like this? There could be a lot of reasons. They realize they forgot to enter in a value in their list of data and just did a regular insert without thinking of shifting the entire row down. Or they were only responsible for data entry and didn’t realize there were formulas in other columns that depended on cells being “aligned” correctly.
There are all sorts of ways to audit formulas like this but I’d argue this is one of the more difficult formula “errors” to catch. The first thing that came to mind was to press CTRL+` to view all the formulas on the sheet:

This is by no means an error proof way of detecting this formula error. You’re basically looking for row inconsistencies in the formulas, and you can see that starting with row 25, you’re multiplying the previous row’s value with the current row’s value. In a bigger model with more complex formulas, this error checking would be more difficult, naturally.
Lack of formula diversity and “smelly” formulas
Another interesting table from Hermans’ report shows how there is very little diversity in the formulas used in Enron’s spreadsheets. This finding also wasn’t very surprising to me. I’d say this is also pretty common at most companies where there is no need for complex or advanced formulas. This table shows that 63.6% of Enron’s spreadsheets only contained 9 functions:

Most models don’t need the FREQUENCY or MID functions when all they’re trying to do is SUM up a few numbers. A lot of analysts think knowing advanced formulas is the key to understanding Excel. The real skill is knowing how to take real-world scenarios and translating those scenarios into rows and columns. Another key takeaway from this table is to learn one of the grandaddy of all formulas: VLOOKUP.
Hermans also came up with a “smell” factor which she coined in a previous analysis of the EUSES corpus of spreadsheets. I think the best way to describe these “smelly” formulas is that they are hard to debug when something goes wrong. Hermans specifically calls out Enron’s formulas have “Long Calculation Chains.” These are formulas that take other formulas as inputs. I’m not sure I would call this formula “smelly” as the whole point of a model is to create building blocks that build on top of one another.

Learning from Enron’s spreadsheet errors
We’ve seen how spreadsheet errors can lead to large financial losses. In Enron’s case, you wonder how much of an impact spreadsheet errors led to their demise, or if these errors are just the regular outputs of a big company trying to get stuff done.
Out of all the Enron emails that contained attachments to spreadsheets, 6% of them contain words relating to spreadsheet errors. These messages are quite mundane and further show that people were just trying to get accurate numbers:
“This was the original problem around the pipe option spreadsheets which we discovered yesterday and the reason why the numbers did not match between the old and new processes.”
“Dear Louise and Faith, I had a review of the spreadsheet and noticed an error in allocation of value for
the Central Maine Power deal.”
“For yet another day we seem to be having problems including all the schedules in our EPE schedule sheet.”
Human error and lack of experience would naturally lead to more spreadsheet errors. When you need to model out different scenarios or plan out a budget, you may be asking people at your company to use Excel for scenarios where Excel is not the right tool. I’ll leave you with this quote from Tim Harford from the Financial Times from The tyranny of spreadsheets:
When used by a trained accountant to carry out double-entry bookkeeping, a long-established system with inbuilt error detection, Excel is a perfectly professional tool. But when pressed into service by genetics researchers or contact tracers, it’s like using your Swiss Army Knife to fit a kitchen because it’s the tool you have closest at hand. Not impossible but hardly advisable.
Other Podcasts & Blog Posts
In the 2nd half of the episode, I talk about some episodes and blogs from other people I found interesting:
- The Peter Attia Drive podcast #189: COVID Part 1: Current state of affairs, Omicron, and a search for the end game
- All The Hacks #37: The Surprising Habits of Backable People


Trackbacks/Pingbacks
[…] a few Excel blunders on the podcast such as the error that led to a $6.2B loss at JPMorgan Chase, Enron’s spreadsheet woes, the DCF spreadsheet error leading to a mistake with a Tesla acquisition, and many others. In these […]